Pages

Wednesday, March 28, 2012

Dividend Yield & Long Term Total Returns

Too often when we look at stock returns (e.g. on Google or Yahoo Charts) all we see is the Capital Gains and ignore dividends which play an important role in total returns. Capital Gains can be thought of as growth in dividends and change in dividend yield. Thus, Total Returns essentially depends on dividend yield and dividend growth.

The following examples will clarify it further. In these examples investments is made at beginning of year 1 (or end of year 0) and returns are at the end of year 1 and year 2.

Example 1: Constant Dividend Growth and Dividend Yield remains constant

This example clearly shows that if yield remains constant then capital gains ((31.43/28.57)-1) is equal to the growth in dividend (10% in this case). Dividends provide adds another 3.85% (1.1/28.57) to the returns.

If the company does not pay any dividends then all the gains are due to capital gains. In this case it would be more useful to look at whether the returns are due to expansion in P/E multiple or due to growth in earnings.

Example 2: Constant Dividend Growth and Dividend Yield Changes


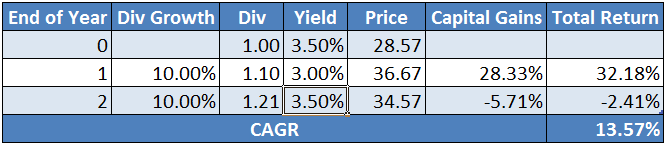
In the first case the yield increases first and then decreases (3.5 --> 4 --> 3.5). In the second case the yield decreases and then increased (3.5 --> 3 --> 3). Note that CAGR is highest when yields go up and then down as compared to if yields were constant or if yields go down then up.

Let us see what will happen to SPY (ETF following S&P500 index) returns if the dividend yields go back to historical levels

Here is a chart of dividend yields of SPY (http://buyupside.com/dividendyieldchart/dividendyieldchartdisplay.php?symbol=SPY)

And here are the actual dividends


The yields went from around 3.5% in 1993 to around 1.75% in 2002 and to around 2% in 2011

Dividends grew at annual rate of 2.66% from 1993 to 2002 and at 6.21% from 2002 to 2011.

This is how the returns shaped up:


Over long term yields should mean revert and go back up to around 3% and dividend growth should revert and go down to its mean of around 4%. This will have serious negative drag on the stock returns. Thus, if you are saving for retirement, college it is important to understand that the stock returns may not be what you might expect looking at historical returns.


Now this may not actually happen dividends may continue to grow at a rate higher than 4% and yields may go down even further. Consider this as a worst case outcome.

Thursday, March 22, 2012

Shorting AGNC

AGNC is a mortgage real estate investment trust (mREIT). The business is to borrow short term and invest in long term securities thus earning difference in yields. The profits depend on the steepness of the yield curve. Currently the yield curve (from http://seekingalpha.com/article/447131-annaly-still-a-buy-despite-another-dividend-cut) is steep i.e. you can borrow at around 0.50% for 2 years and lend it between 1.5% to 2.0% for 5 to 7 years.


By law mREITs are required to pay more than 90% of their income. So to continue operating these companies need to raise money frequently. AGNC has been issuing equity instead of borrowing.

Recently AGNC cut its dividend from $1.4 / share to $1.25 / share dropping its yield from ~20% to ~16%. I am expecting the yield to go up to 20% and thus price to drop to around 26/27. Based on this belief I recently bought puts on AGNC. I bought June 2012 put at a strike price of 29 for ~$1. Thus my break-even point is at 28. I have up to June 12, 2012 for the price to fall to that level.

The stock has held up fairly well since I bought the Put. I believe the stock has been helped by rising stock market. So, I think I will wait for some more time before closing the position.

Wednesday, March 21, 2012

Permanent Portfolio & Minimize Fat Tail Portfolios

I stumbled on to Permanent Portfolio (inspired by Harry Browne) over 1.5 years back. I am actually invested in this portfolio for almost an year and it has provided good returns. I worry about high gold and long term bond allocations in the portfolio but so far it has held up pretty nicely. I am not sure how it would work in the future.

In the simplest form the portfolio consists of 4 assets at 25%. These are:

  1. Total Stock Market (VTI) - 25%
  2. Gold (GLD or IAU) - 25%
  3. Cash (can be replaced by Short Term Treasury - SHV or SHY) - 25%
  4. Long Term Treasury (TLT) - 25%
If you want to learn more you can read more at http://crawlingroad.com/blog/ and follow the discussion at http://gyroscopicinvesting.com/forum/index.php.

Another strategy I am interested in is the Fat Tail minimization by Larry Swedroe. The assets in the portfolio are:

  1. Small Cap Value (VBR/IWN) - 15%
  2. Emerging Market (VWO/EEM) - 15%
  3. Inflation Protected Treasury (TIP) - 35%
  4. Short Term Treasury (SHY) - 35%

Both these strategies are expected to provide returns with low volatility. Fat Tail Minimization is equivalent to traditional 30/70 portfolio but the stock portion has relatively higher risk and bond portion has relatively lower risk (does not include corporate bonds).

Over the next few posts I will outline various flavors of the above strategy and documenting my results. Once I have described various portfolios I plan on updating the results every month.